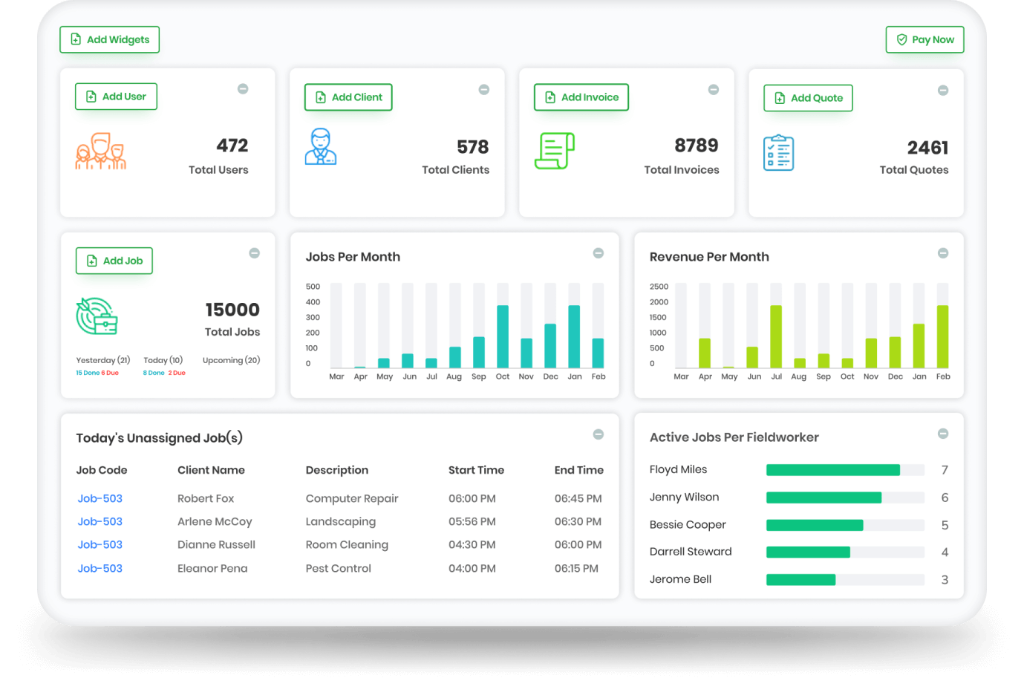
Alarm Fatigue & Visual Noise
Friction
Dashboards showed all alerts with identical visual weight, overwhelming operators.
Design solution
Created an intelligent severity-weighted visual feed that groups correlated telemetry events.
Designed the flagship analytics workspace for Pureblue.ai, enabling operations leaders to monitor IoT and operational data streams and take automated corrective actions.
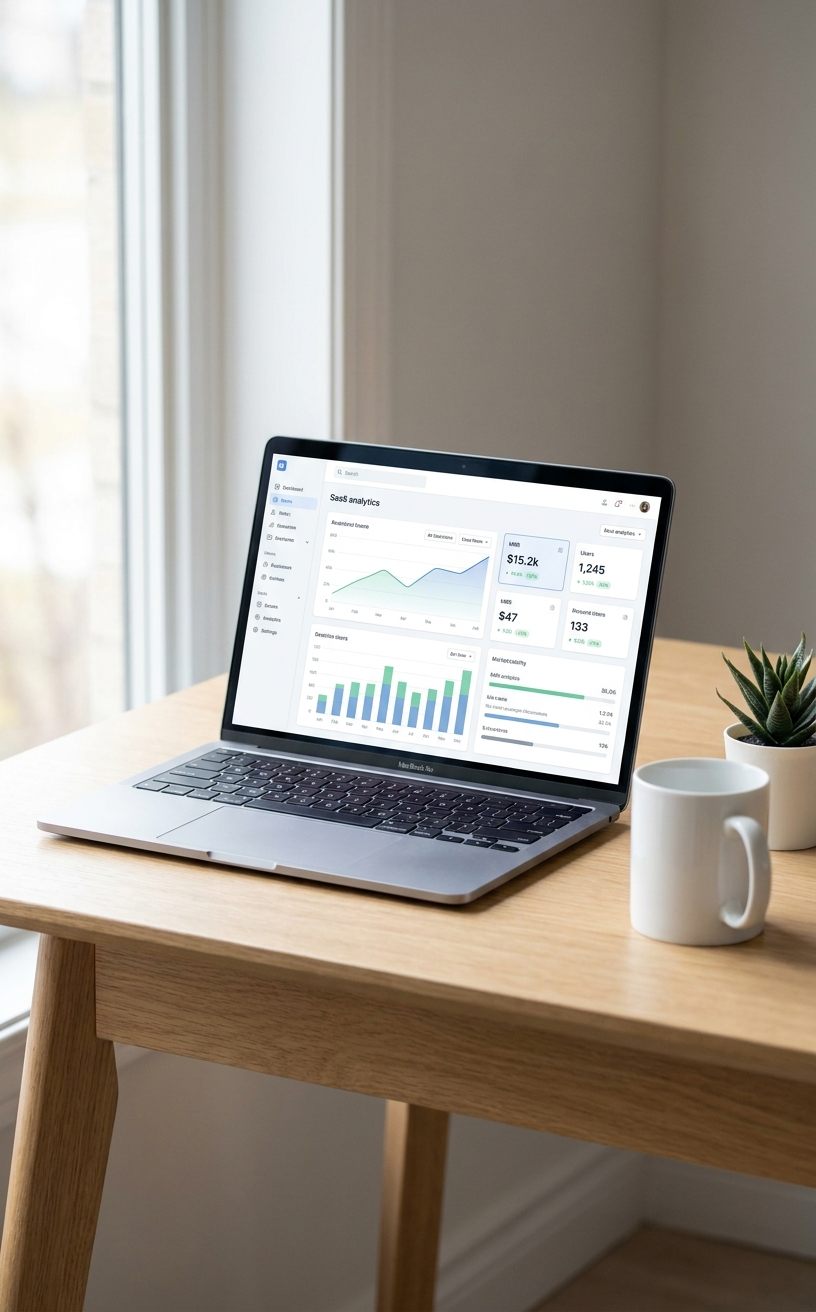
The challenge
Operations teams were experiencing critical alarm fatigue: hundreds of flashing notifications caused operators to miss the 2 or 3 critical system failures that actually required physical intervention.
Key decisions
Friction
Dashboards showed all alerts with identical visual weight, overwhelming operators.
Design solution
Created an intelligent severity-weighted visual feed that groups correlated telemetry events.
Friction
Filtering telemetry data required writing custom SQL queries that slowed frontline managers.
Design solution
Designed a conversational natural-language query bar paired with visual facet filters.
Friction
Investigating an anomaly required switching between 6 disparate telemetry tools.
Design solution
Built unified modal drill-downs showing time-series charts, affected hardware IDs, and recommended fixes.
Results
Real-time anomaly detection across 100,000+ data streams.
The interface Durga delivered made our complex algorithms simple and actionable. Our customers couldn't stop praising the dashboard.
— Pureblue Founder, CEO · Pureblue.ai